Keeping track of your campaign performance and analytics data is important! This guide will show you how to view all your data and analytics including campaign performance, list building subscriber metrics and more within the Voyage app.
Note: All times and date ranges in your Voyage app are based on your browser's local time zone. All metrics shown in the Voyage web app have a ~1.5 hr delay.
Dashboard
The Dashboard [1] is where you'll see a summary of most of your high-level company performance data. You can change the date range [2] covered by the summary, and see a quick preview of upcoming campaigns [3]. Along the left side are some additional important metrics [4] defined below. You can click on the drop-down here [5] to specify which segment you are viewing, New Subscribers, Active Subscribers, or Unsubscribes:
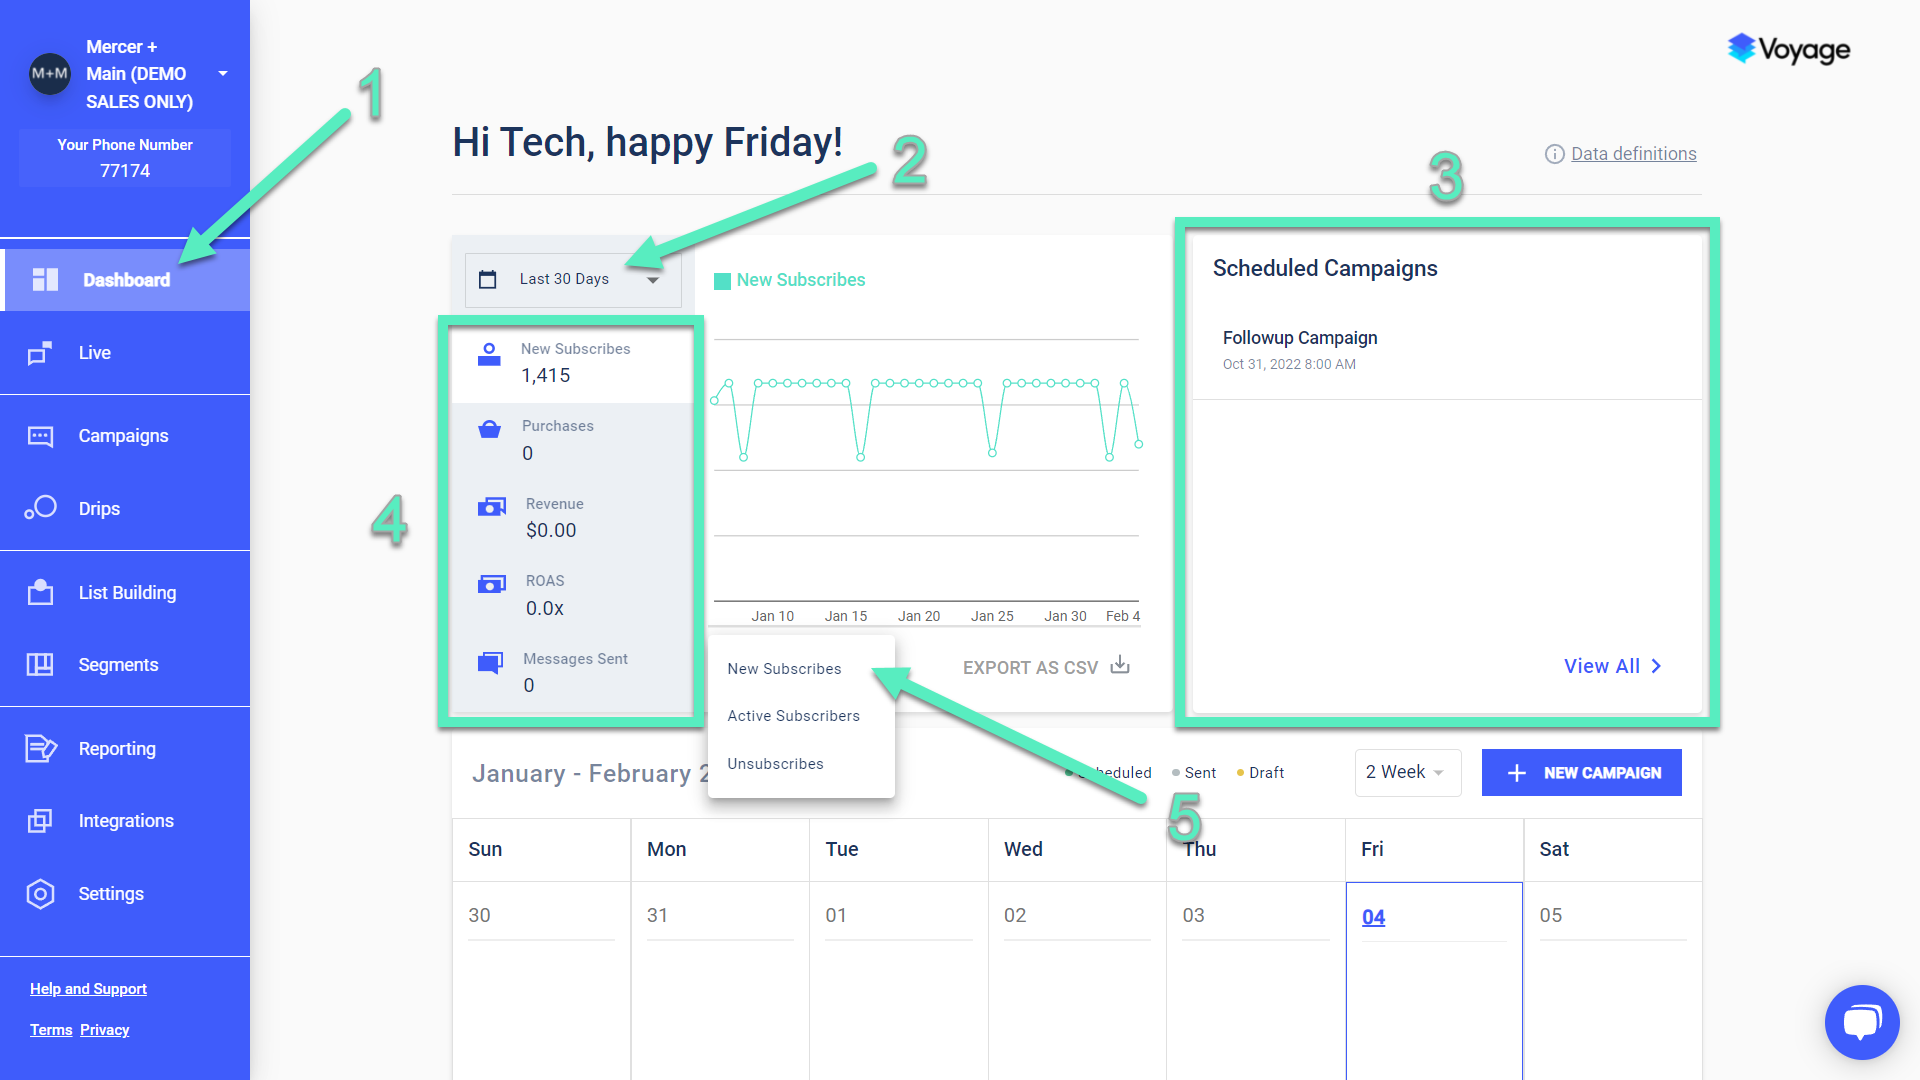
New Subscribers: number of new unique phone numbers added whose owners have consented to receive messages
Active Subscribers: number of currently active subscribers, no matter what the selected date range is
Unsubscribes: number of subscribers who opted out during a given time period
Purchases: number of buy transactions from subscribers that clicked on an SMS link and completed a sale (attribution window is infinite)
Revenue: income from subscribers that clicked on an SMS link
Segments Sent: number of SMS or MMS segments sent from your account to your subscribers. A single SMS or MMS message can be made up of multiple SMS segments, depending on character length. More details on character lengths and how they impact messages and segments can be found here.
Note each of these metrics can be clicked on to bring up an interactive chart. For example, when clicking on Segments Sent [1], you will be shown two tabs, Messages Sent [2] and Segments Sent [3]. Hover over the graphs [4] to see extra data, and even make an additional regional selection [5]. You can also export the data to CSV [5]. This export data file contains new subscribes, active subscribers, unsubscribes, re-subscribes, purchases, and attributable revenue generated for the specified time period:

Campaigns
One-time Campaigns [1] are a great way to run special promotions and stay connected with your subscriber base. At the top, aggregates for the most important metrics are shown [2] with each campaign's separate contributions broken out in the rows below [3]:

Here are more detailed definitions for all the metrics found on the Campaigns page:
Sends: number of messages sent
Clicks (both unique and not unique): number of clicks on the link(s) sent in the one time campaign
CTR = total number of clicks / total number of sends
Purchases (not unique): number of buy transactions for subscribers that clicked on the link(s) in the one time campaign and completed their purchase. Attribution is given to last click, so if a subscriber clicks on a Drip and then purchases, the purchase will be counted for the Drip, not for the one time campaign shown here.
CVR = total number of purchases / total number of sends
Revenue: total revenue generated from the total number of purchases (Attribution window is last click, so if a subscriber clicks on a Drip and then purchases, revenue will be counted for the Drip, not for the one time campaign shown here).
Unsubscribes: number of subscribers that unsubscribed after receiving the one time campaign
Unsubscribe rate = total number of unsubscribes / total number of sends
ROAS: Return On Ad Spend measures the amount of revenue earned for every dollar spent on advertising
Drips
Drips are useful for scheduled followups after a specific event. Click on Drips [1] to see the similar four major metrics at the top [2] with more Drip campaign details below [3]:
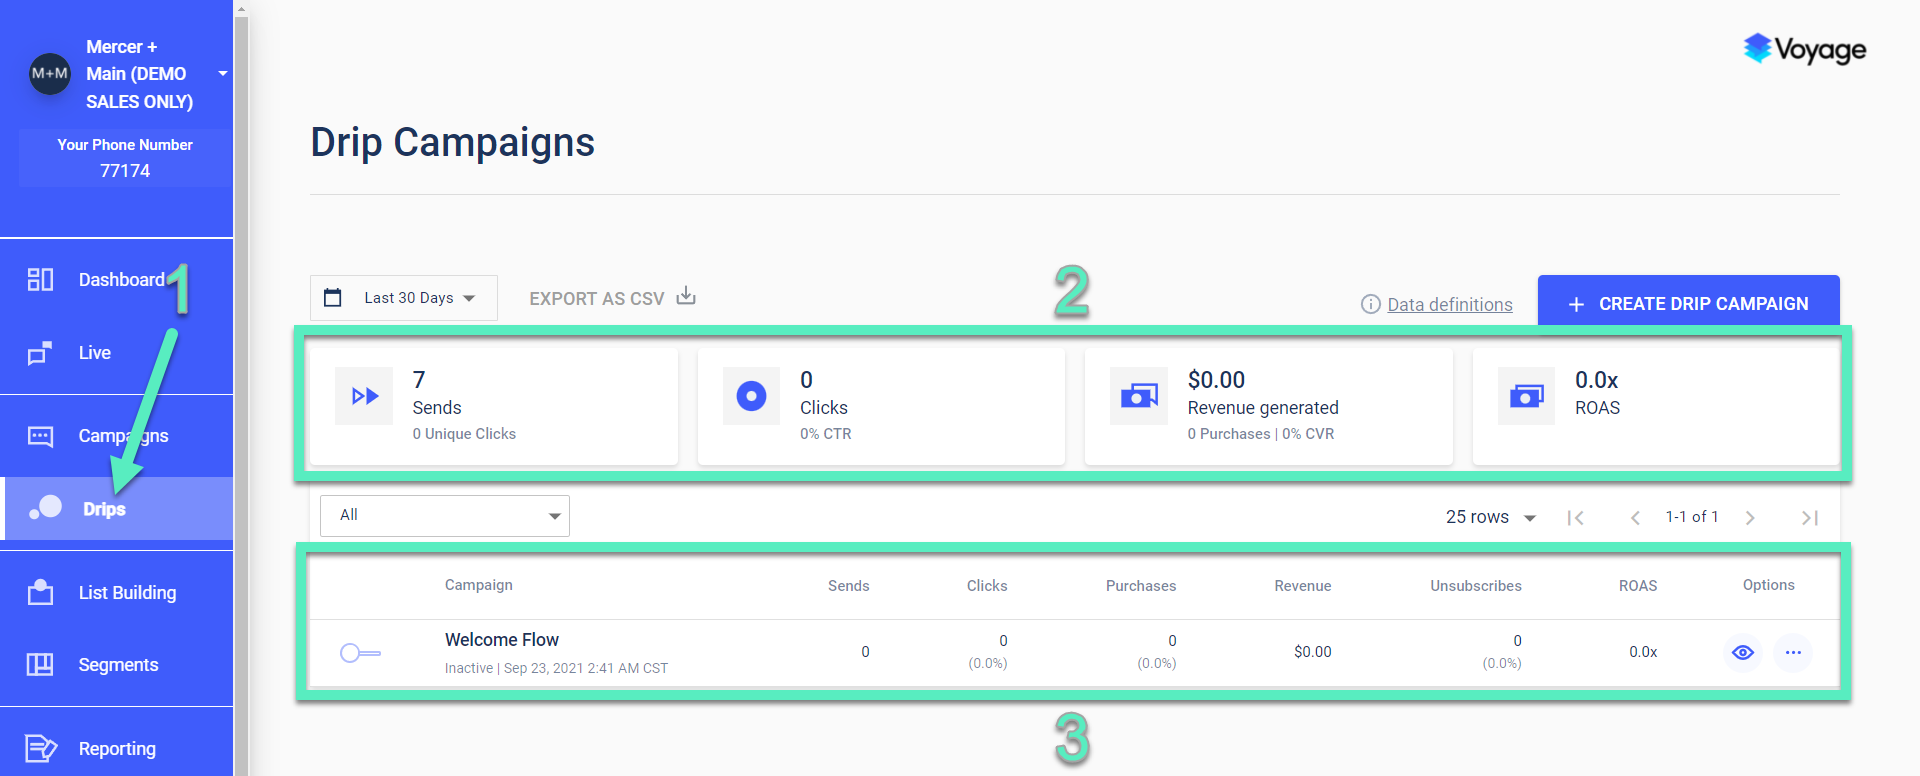
Note that all the metrics shown here are the same from the Campaigns main page. Please refer back to that section for metric definitions.
List Building
List Building [1] is the main interface to manage your subscriber list growth efforts. At the top there are four important metrics [2] and special access to A/B Testing reports [3]. Each row below represents one List Building campaign [4], with the metrics defined as below:

These are more detailed definitions of the metrics you'll find on the List Building page:
Impressions: number of users that saw that list building campaign
Modal Clicks: number of clicks on the modal
Subscribers: number of new subscribers from that specific campaign
Clicks (not unique): total number of clicks on welcome flow SMS links from all modals
CTR: total number of clicks / total number of impressions
Purchases (not unique): number of purchases for subscribers that clicked on the link(s) in the welcome flow and purchased (Attribution window is last click, so if a subscriber clicks on a Drip and then purchases, the purchase will be counted for the Drip, not for the welcome flow shown here).
CVR: total number of purchases / total number of impressions
Revenue: total revenue generated from the total number of purchases (Attribution window is last click, so if a subscriber clicks on a Drip and then purchases, revenue will be counted for the Drip, not for the welcome flow shown here).
Short Links and UTMs
We convert any URLs in messages to short links for tracking and attribution purposes (e.g., clicks and purchases). These are unique to the individual consumer.
We also append default UTMs to these links so that you can track inbound traffic from these short links in Google Analytics, Mixpanel and/or other analytics tools. You can modify these UTM values and/or add additional UTM parameters, as desired, in your Settings panel in the Voyage app.

If you have any additional questions please contact us at [email protected].